
Now available · Q2 2026, The Pullback Quarter
Freight’s first benchmark for measurable, scalable GTM efficiency.
Median LGER across 17 measured programs, as every quartile cooled from Q1’s peak.
See what’s driving it, and how to benchmark against your ICP peers.
About the SCGI
Measure what truly matters: pipeline created per dollar of GTM spend.
The Supply Chain Growth Index (SCGI) is a quarterly benchmark designed for freight and logistics leaders.
Born from SaaS, where the Growth Efficiency Ratio (GER) became the gold standard for balancing scale and profitability, we’ve adapted it for freight, creating the Logistics Growth Efficiency Ratio (LGER). It’s the first time this proven performance metric has been applied to the logistics industry.
It gives leaders a clear way to
- See where you stand on pipeline created per $1 GTM spend (LGER).
- Understand how full-funnel GTM shortens cycles and raises deal velocity.
- Learn how high and low LGER can affect your ability to scale.
What’s inside the Index
Q2 2026, The Pullback Quarter.
01
LGER benchmarks
Median, mean, and quartile bands for pipeline created per $1 GTM spend.
02
Market reality
How a capacity-driven recovery, tariffs, and Montgomery are showing up in pipeline.
03
Executive takeaways
Benchmarking by ICP, ABM’s effect on LGER, and what to watch in Q3.
Why LGER matters
One metric to align Marketing, PR, Demand Gen, and Revenue.
- High LGER
Scalable efficiency. - Low LGER
Wasted spend and a leaking funnel. - Exceptionally high LGER
Underinvestment masking capped growth.
The formula
LGER = Pipeline Created ($)
÷ GTM Spend ($)
GTM spend includes media, PR, tech, vendors, and marketing headcount. Sales labor excluded.
The methodology
How the Index is built.
Sample & scope
Freight tech, 3PLs, brokers, and logistics providers; asset-light and asset-heavy; mid-market and enterprise.
Timeframe
Continuous 12-month dataset segmented quarterly to reduce seasonality. Programs without a full quarter of pipeline history are excluded from that quarter’s figures.
Formula
LGER = Pipeline Created ($) / GTM Spend ($). GTM spend includes media, PR, tech, vendors, and marketing headcount; sales labor excluded.
Listen now
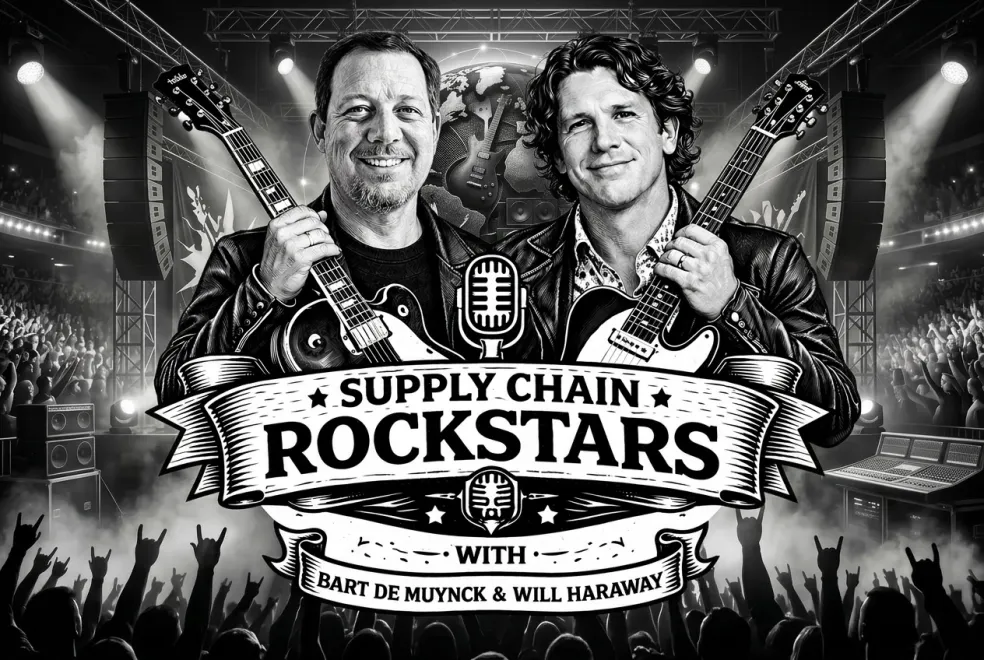
Supply Chain Rockstars
The podcast for the people moving freight, with Will Haraway and Bart De Muynck.
Listen to the podcast →More from LeadCoverage
Keep the conversation going.
Upcoming webinars
Plan for a successful 2027. Join live sessions with our leadership team.
Save a seat →Where does your LGER land?
We’ll benchmark your GTM against the Index and your ICP peers.
Book time →Our expertise
LeadCoverage is the leading go-to-market consulting firm built for the global supply chain. We help supply chain, logistics, and tech providers turn complex markets into measurable growth through strategic PR, analyst relations, demand generation, and sales enablement.